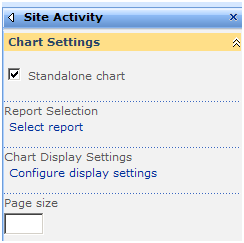
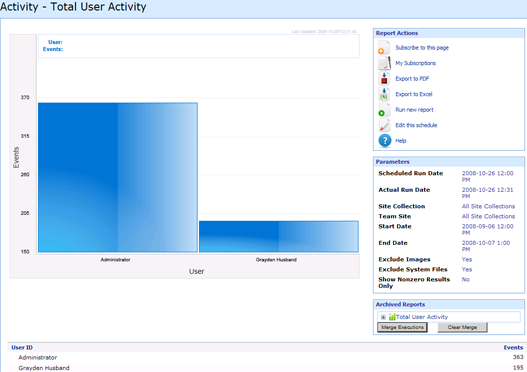
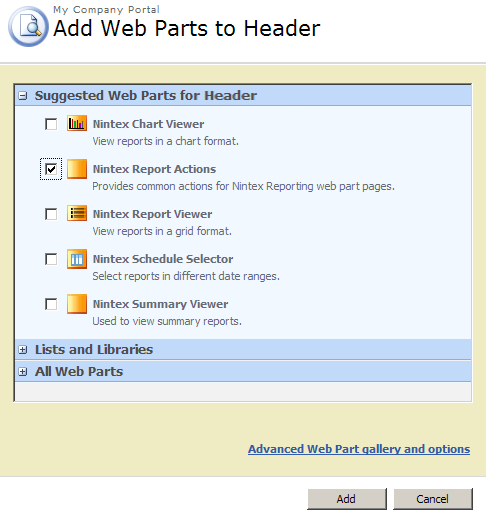
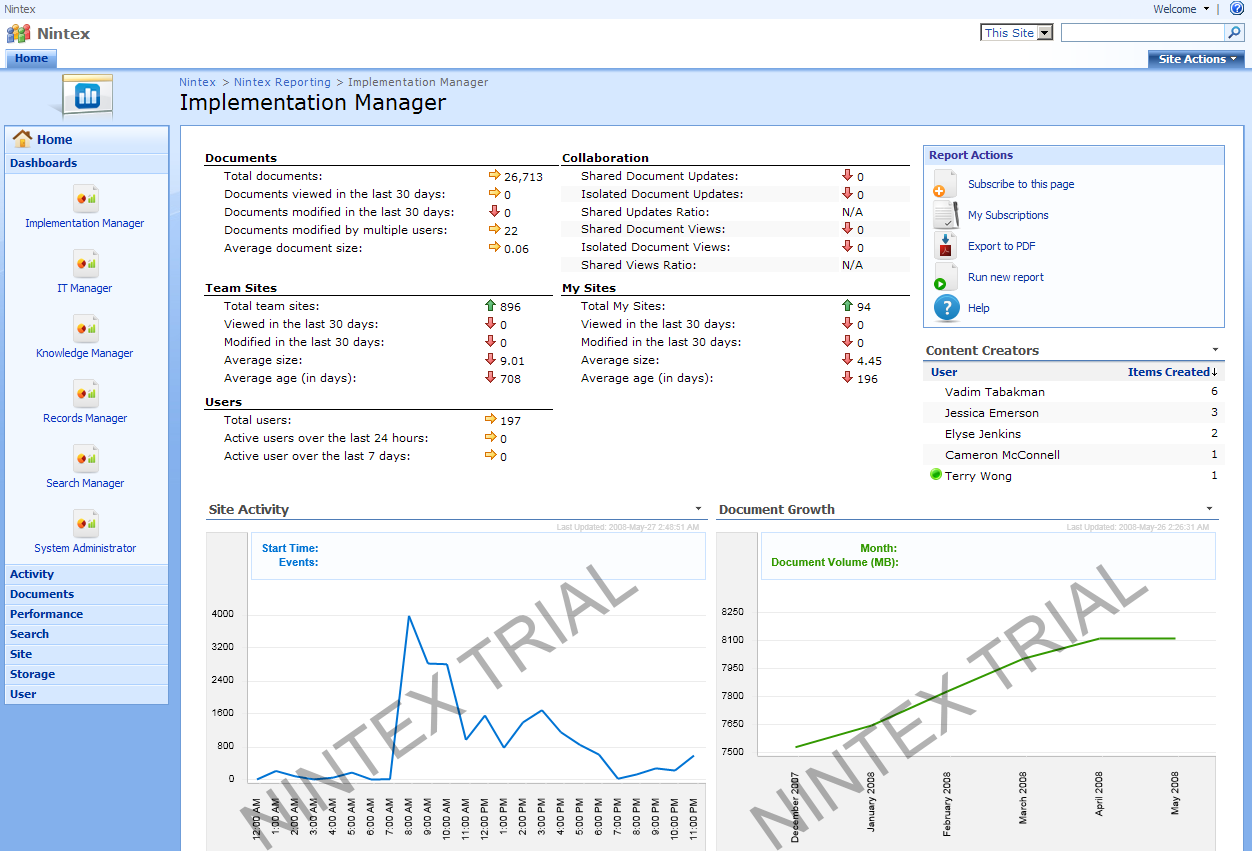
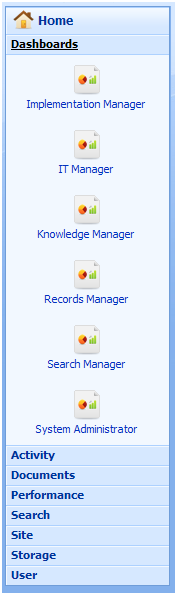
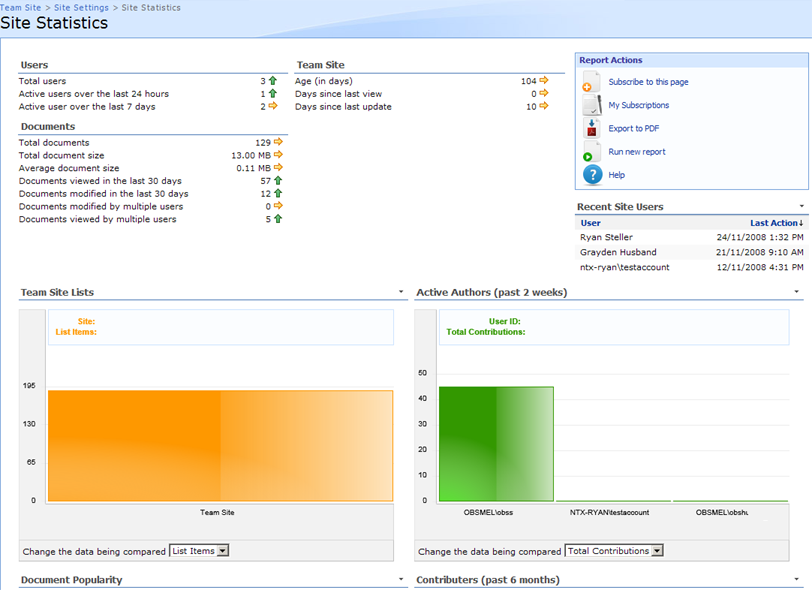
The Chart Viewer web part is used to graphically display reports. This web part can be found in the "Suggested Web Part for..." section or under the "Nintex Reporting" category of the "All Web Parts" section.
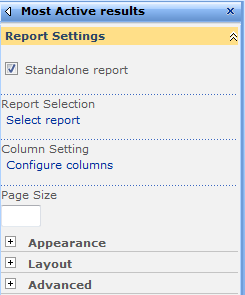
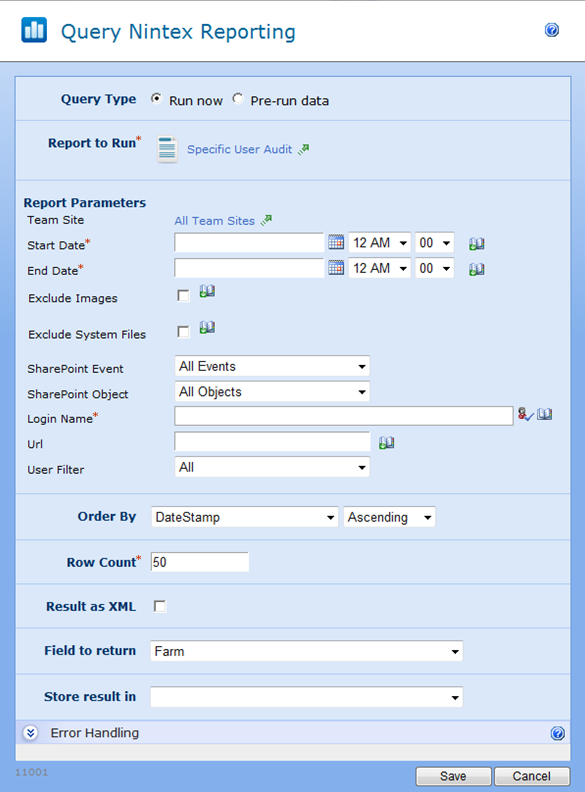
This web part can operate in either "Standalone" or "Connected" mode. In connected mode, the data in this web part is directly related to another web part on the same page. In standalone mode, a report must be selected. Click on "Select report" to make a selection.
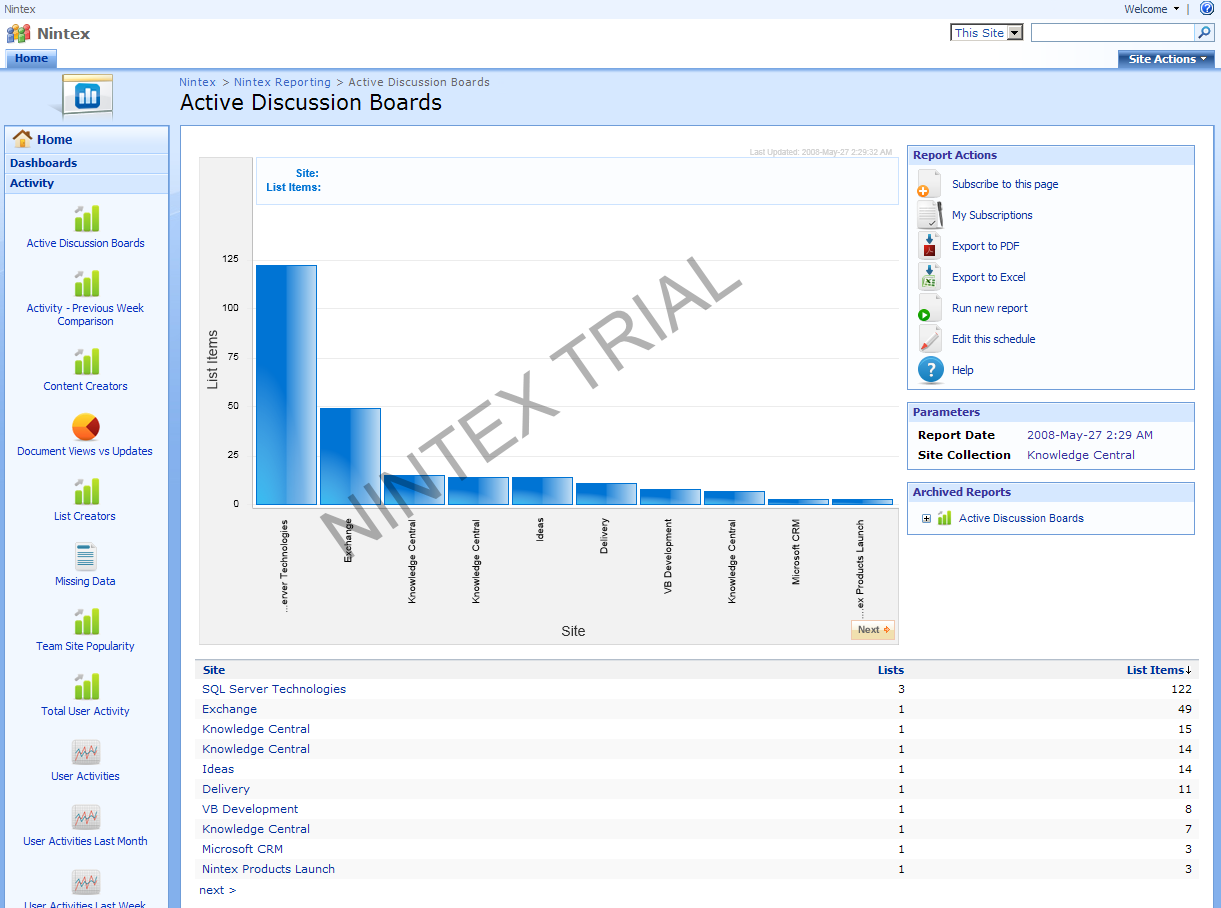
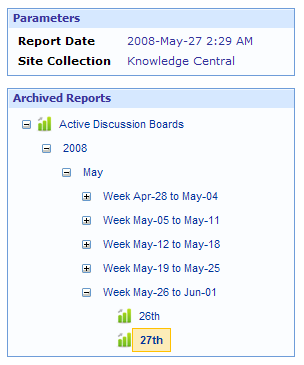
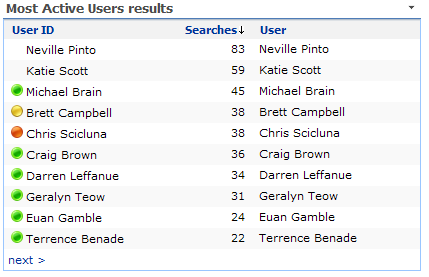
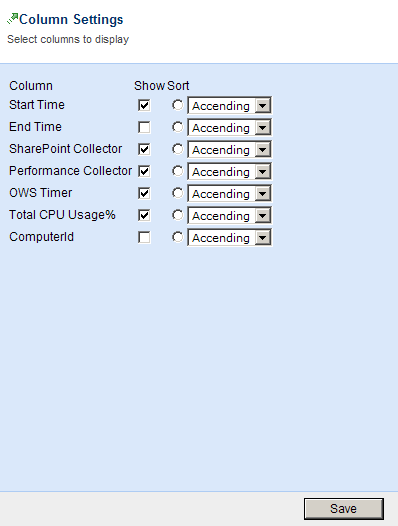
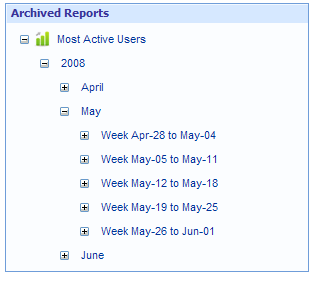
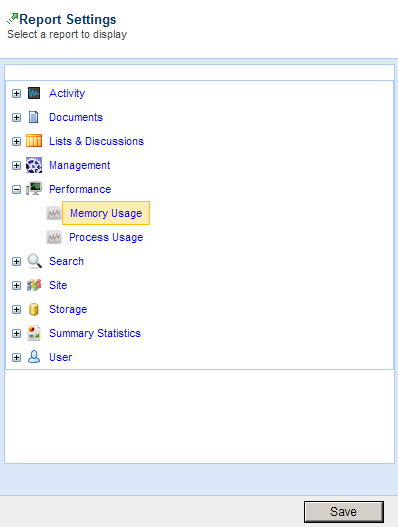
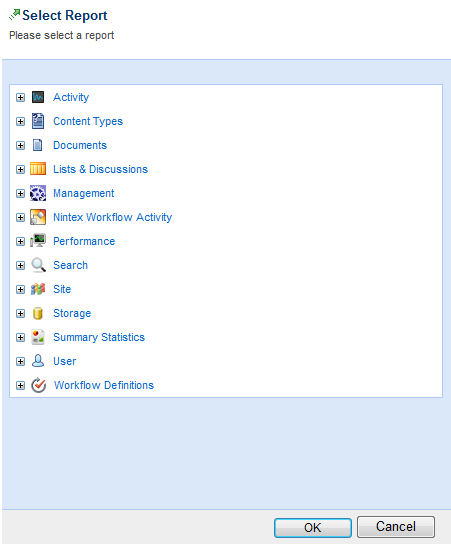
Using the report tree, browse and select a report to display.
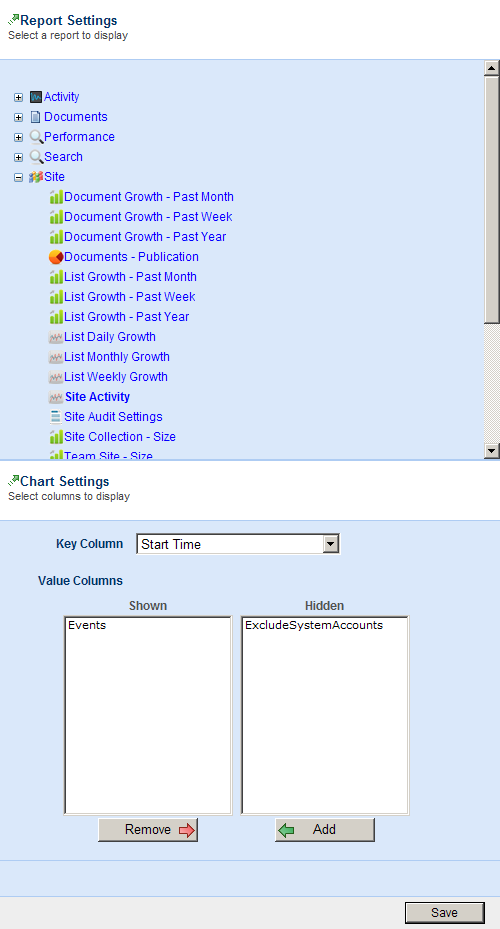
The columns in the selected report are displayed. A single "Key Column" and one or more value columns should be selected. Click Save to secure your selection.
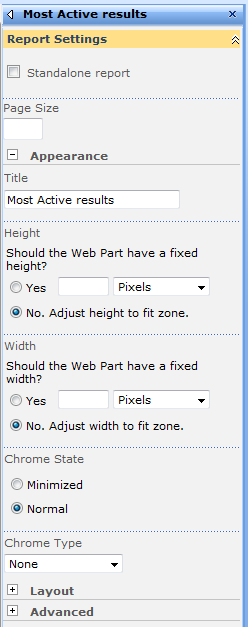
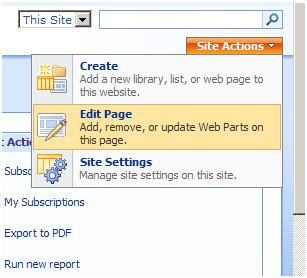
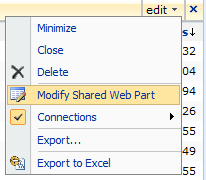
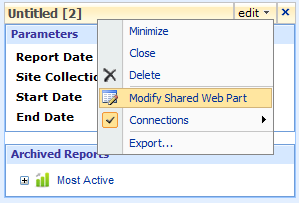
To configure how the chart is displayed, click on "Configure display settings".
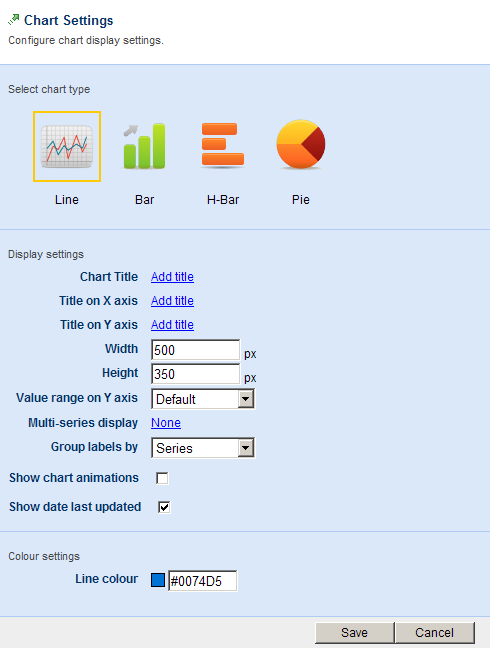
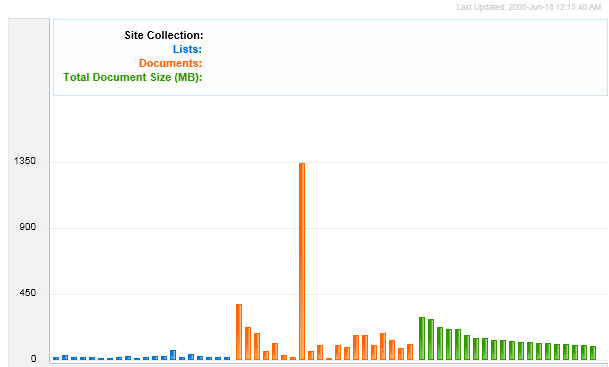
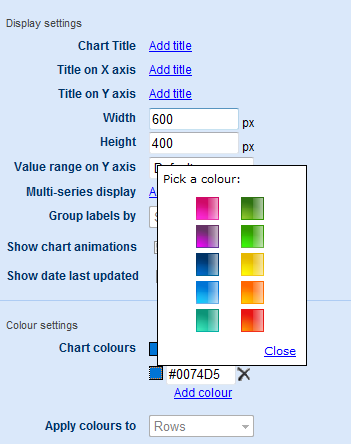
Here you can select the chart type. The options are line, bar, horizontal bar and pie. You can configure the chart title, as well as titles for the x and y axes by clicking the "Add title" hyperlinks to expose text fields.
On a typical computer monitor, 100 pixels normally represents around 3.5 centimetres or 1.4 inches.
By default, the report will be displayed with Y-axis values that are calculated to best fit the page display. However, if you are displaying reports that are comparing similar information in differently sized web parts, the display can become less meaningful and more difficult to read. You can use this setting to set exact values to ensure that data comparison between different chart web parts is relational.
This option allows you to configure how a second or subsequent series of information is displayed in conjunction with the first.
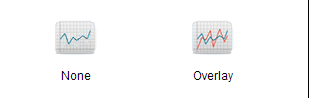
To turn off Multi-series display, set to None. Otherwise use the following settings.
For line graphs, select "Overlay" to display multiple lines on a chart.
For bar and horizontal bar graphs, there are three options: "Adjacent", "Sequence" and "On Top".
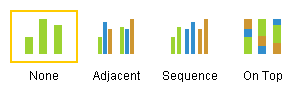
When the "Adjacent" display is used, all the same column types from different series are displayed directly next to each other. This means that every element of like data is displayed next to each other and that every different column of information is displayed in a new set.
When the "Sequence" display is used, an entire set of data in a series is displayed in a group before the next series of data is displayed in a similar group.
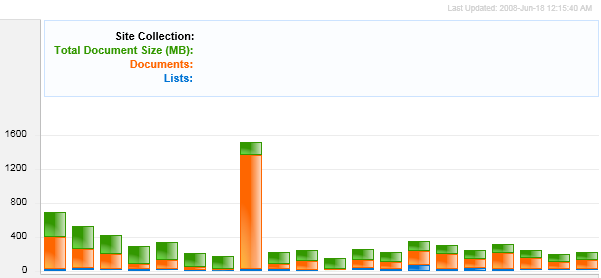
When the "On Top" display is used, each element of like data is displayed one on top of the other, resulting in a single, multi-coloured bar.
You will need to add extra colours manually to ensure your data can be differentiated visually. To do so, click the "Add colour" link, then click the coloured square that appears to display the colour picker window. Then simply click a new colour.
Once you have entered all your information, click the "Save" button. You can then click the "Apply" or "OK" buttons in the web part options panel to the right of the page.
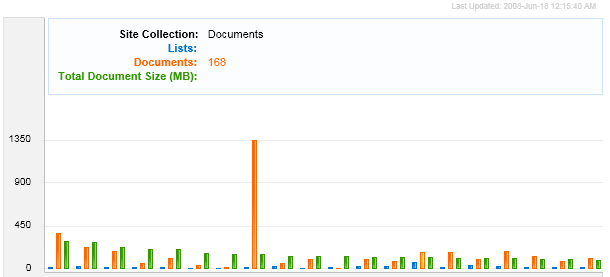
PLEASE NOTE: For the chart to display, you need to refresh the web part display by clicking the "refresh" link within the web part.
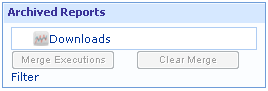
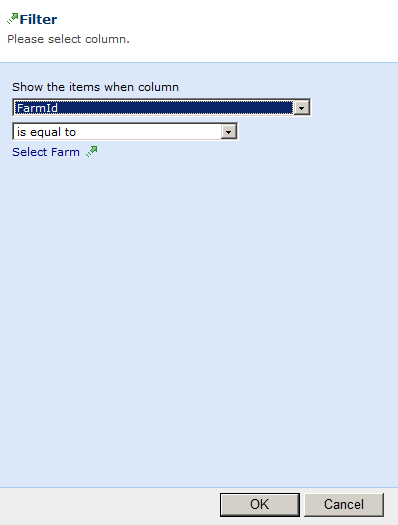
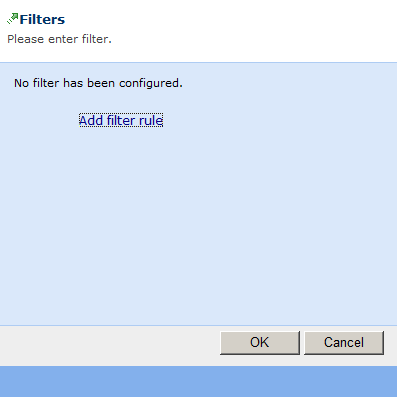
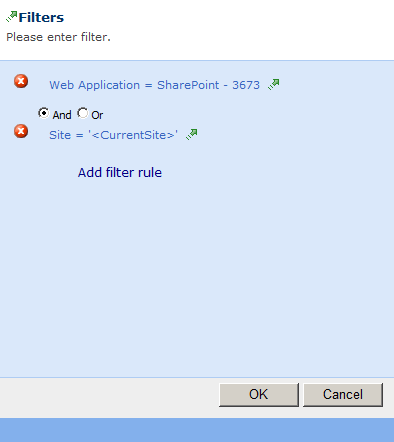
You can define rules to display specific report data using the Data Filter dialog screen.
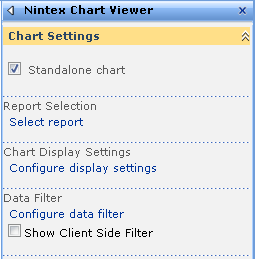
Select the Configure Data Filter link to display the client side Filter dialog screen. Any rules set up in the server side filter will be saved and always applied to the report data. To display the client side filter on the report page enable the option 'Show Client Side Filter screen'.
Click here for more information about Filters.
To Import or Export a report select Import / Export base Report from Site Settings.
To import a report select Import Report.
Select Browse and locate the Report you wish to import. Note that you can only import a file with a .nrr type extension.
Once selected the report name and description will be displayed. If you have selected the wrong report click 'Select a new file' and select a different report to import. Otherwise click Import to Import the report.
Note: If the report that is being imported already exists in Nintex Reporting, importing will overwrite the report and any of its existing schedules, data and subscriptions. A warning message is displayed advising of this.
To export a report click the 'Export' link in the list for the matching report and choose a location to save the nrr file.
To import a report page or dashboard select Browse and locate the Report you wish to import, and click "Import". Note that you can only import a file with a .nrd type extension.
A list will be displayed of all schedules which must be configured before the page can be imported. These will be the schedules used by the Nintex Reporting web parts on the imported page. Click on each schedule to configure.
Specify a target file name and document library in which to import the report page. Once complete click "OK" to complete the import.
To export a Nintex Report page, locate the report page in the Report Center or document library, and click the "Export this page" option from the item drop down menu.
Item Level Reporting provides an in-depth view of all actions carried out on an individual item. For example, you can view all actions carried out on a confidential document in your SharePoint environment to see who has viewed or edited the document.
To enable Item Level Reporting, you must activate the Nintex Reporting 2008 audit report menu action feature.
Go to Site Settings, then Site Features, under the Site Administration section.
Click the Activate button to enable the Nintex Reporting 2008 audit report menu action feature.
Navigate to a document library, for example, and move the cursor over the item's title to activate the edit menu.
Click on the down arrow, and then View Audit Report.
The Audit Report will open showing all actions relating to this item.
Note that because the Audit Report shows in-depth information, the user attempting to view the
Audit Report must have Run now access.
Go to Site Settings and click on the Run now access link to add the user to this group.
If the user attempting to view the Audit Report is not a member of the group, an Access Denied
message is displayed.
The Manage Report Schedules page provides a list of all reports which have been scheduled to run, displaying their start date, when they will run next, and when they will finish.
To edit a report schedule, click the link under the "Name" column. To schedule a report to run, click on the "Schedule a report to run" link.
The Manage Subscriptions page provides a listing of your subscriptions to reports and dashboards.
To edit a subscription, click the link under the "Report" column beside the subscription. To remove a subscription, click on the "x" image beside the subscription under the "Remove" column.
To add subscription, click on the "Subscribe to this page" link in the "Report Actions" box on any report or dashboard page.
Merge functionality allows multiple executions of the same report to be displayed on a chart.
There are 2 different styles of Merge functionality based on the type of report:
- Time-based reports; reports displaying data across regular time intervals (eg Month Growth, Weekly Growth or Daily Growth), and
- Non time-based reports; reports displaying numeric data, such as file size, numbers of users or numbers of events (eg List Creators or Team Site Size)
To merge executions, select a report for which the Merge functionality has been enabled, eg Activity - Total User Activity
Note that the Archived Reports box contains 2 buttons to Merge Executions and Clear Merge. These buttons will appear only for reports which are capable of being merged.
By default, the most recent execution will be selected in the Archived Reports tree. Here, the report for Sunday 26th October is selected.
To Merge executions, tick at least 2 boxes in the Archived Reports tree.
Press the Merge Executions button to merge the results. Note that the chart now has 2 executions.
The grid displays extra columns for each execution. Column heading are labelled to match execution dates.
To revert back to the latest execution, click the Clear Merge button.
Note that merging 2 executions which use a chart type of Pie Chart will result in a chart type of Bar Chart.
The Report Actions web part is used as a common menu throughout the Nintex Reporting Center. This web part can be found in the "Suggested Web Part for..." section or under the "Nintex Reporting" category of the "All Web Parts" section.
This web part can operate in two modes - "Stand alone" and "Connected". When connected to a "Schedule Selector" web part, additional links to "Export to Excel" and "Edit this schedule" will appear. The "Run new report" link will load the "Run now" page with the parameters used by the selected schedule.
Action | Description | Standalone | Connected |
Subscribe to this page | Allows a user to subscribe to the reporting page. See Report Subscriptions. | X | X |
My Subscriptions | Links to the "Manage my subscription" page. | X | X |
Export to PDF | Exports the current page to a PDF file. | X | X |
Export to Excel | Exports the current report data to Excel. | X | |
Run new report | Run a new report now. | X | X |
Edit this schedule | Configure the parameters, schedule, and frequency of this report. | X | |
Help | Links to this document. | X | X |
The Nintex Reporting 2008 Reporting Center is installed by the system administrator to a designated team site. To access the Nintex Reporting Center, navigate to the appropriate team site and select the "Nintex Reporting" link in the left hand menu.
Note: The default title, "Nintex Reporting", may have been renamed by your site administrator.
After clicking the Nintex Reporting (or equivalent) link, the Reports "Dashboards" page will load - this is the Nintex Reporting Home page. A Dashboard is a web part page targeted to a specific professional role and contains a number of reporting web parts related to or relevant for that role.
Click to view one of the Dashboard pages or you can browse through the report categories that are provided in tab form near the top of the page. You can then select a specific single report of interest.
Once you select a specific report or dashboard, all Reporting navigation is transferred to collapsible categories in the left navigation pane of the page. You can return to the home page at any time by selecting the "Home" link in the navigation menu at the left of the page.
Report pages are divided into two main categories - Dashboard pages and Report pages.
Dashboard pages provide summary statistics and snap shots of specific reports relevant for a specific user role. The web parts on a dashboard page are standalone and are not dependent on one another.
You can re-arrange, add and remove reporting web parts from dashboard pages by selecting the "Edit page" link from the Site Actions menu.
Single Report pages are designed to display a single report in detail. The web parts used on a single report page are connected and dependent on one another. Paging or sorting in the chart will affect the grid and vice versa.
On a single report page you can see the specific parameters used to create the report in the "Parameters" web part. This normally consists of the date the last report was run and its scope.
You can access previous report runs by browsing and selecting a run date from the Archived Reports tree. The number of archived reports kept is configured by a schedule administrator.
Common to both dashboard and single report pages is the left hand navigation menu.
Similar to the menu displayed on the home page, all reports and dashboards are displayed and arranged by category. Clicking on a report category allows you to toggle it between expanded and collapsed. Clicking on an icon will navigate to that report or dashboard.
Clicking on the Home link will navigate to the Report Center home page.
You can define rules to display specific report data using the client side Filter dialog screen.
Select the Filter link to display the client side Filter dialog screen.
Click here for more information about Filters.
Select the Filter link to display the client side Filter dialog screen.
The Report Viewer web part displays the raw data for a selected report.
You can change from where a Report Viewer Web part sources its data and whether or not it is related to the other web parts on the page. To modify the web part, select "Site Actions" then "Edit Page". You will need to be signed in to SharePoint using an account with sufficient privileges. You can then locate the Report Viewer web part you wish to modify. Click the "Edit" drop-down then "Modify Shared Web Part".
The Report settings section of the web part will be shown.
Reports are rendered by Microsoft Silverlight and can be configured to automatically fill the available space or to fit an exact, specified space.
Select a SharePoint design zone in which to place the web part (shown in the drop-down).
Select this option to break any shared data connections between this and other web parts on the page.
Upon selecting "Standalone report", the Report Selection and Column Setting links are displayed.
The Report Settings pane allows you to select any of the reports that are available to the system.
The Column Settings pane will display the columns available in the selected report and allow you to sort them in ascending or descending order.
The Run New Report functionality provides the ability to run adhoc reports directly against the Nintex Reporting audit tables.
Reports accessed via the left-hand menu have been pre-run and cached, and therefore provide a historical view of data. The Run New Report
functionality provides access to a current snapshot of audit data.
The Run new report link under the Nintex Reporting heading in Site Settings provides access to this functionality.
Click on the link to open the Run Report page.
Click on the Select Report link to open the Report Selector dialog.
Expand the categories and select a report to run.
Clicking OK will then close the Report Selector dialog. The Run Report page now displays the parameters applicable for the report selected.
Fill in the parameters as required.
Click OK to run the report.
Note that there is an Export to Excel link in the top left Report Actions box.
Click the Export to Excel link to open the File Download dialog. You can choose to Open or Save the report data in .xls format.
The Excel file contains the result set for the report.
Note that you can access the same functionality by clicking Run new report in the Report Actions box.
Click on the Run new report icon.
By clicking this icon from an existing report, the Run Report page will open with the parameters pre-configured with the more recent report values.
Nintex Reporting introduces four SharePoint Groups for its security roles when the
Reporting Center is created.
Users or groups added to this SharePoint group can view the results of scheduled reports.
Users or groups added to this SharePoint group can run new reports on the fly directly against the data warehouse.
Users or groups added to this SharePoint group can create and edit report schedules.
Users or groups added to this SharePoint group can perform all the tasks described in the groups above.
Permission you need have for audit menu report action is View Versions - View past versions of a list item or document.
Individual schedules can be secured to any specified SharePoint group. This allows a user to create a sensitive report and only make it visible to select users.
The Schedule Selector web part is used to display a tree view of all the previously run and archived reports. Navigation hierarchy is by year, then month, then week, then day, where applicable.
Navigation is easy - simply expand or contract the categories and sub-categories until the desired report is available to select. Selecting the desired report will display it in the same page.
Any of the reports available to the system can be chosen for display. Choosing a report in this way will break any existing relation between this web part and the others on the page in the case of a Single Report page. To create a dependency, which will link the information selected for this web part to others on the page, click the "Connections" fly-out then "Send Selected Report to" then choose the name of another web part on the page.
The Team Site Reporting feature provides reporting targeted at a specific Team Site. To activate the feature, go to Site Settings. Click the Site features link under the Site Administration heading.
The Nintex Reporting 2008 Team Site Reporting is listed under the Site Features.
Click the Activate button to activate this feature. The status is now Active.
In Site Settings, there is a new section called Nintex Reporting 2008 Team Site Reporting. This contains links to the new reporting capabilities targeted towards the current Team Site.
The Run new report link opens the Run Team Site Report page. This is identical to the existing Run new report functionality, available from any report page, except that the selected report is already targeted towards the current Team Site.
Note that the current Team Site is selected. This is readonly and cannot be changed. This allows users to be given access to a specific Team Site and reports based on that Team Site's data, yet not be able to view information from other Team Sites.
The Site Statistics Site Settings link provides access to a dashboard which gives an information overview of the current Team Site. All reports on the Site Statistics page have been targeted towards the current Team Site.
The Manage Report Schedules Site Settings link opens the Manage Report Schedules page, allowing access to schedules specifically created for the current Team Site.
Firstly create a new Schedule by following: Manage Report Schedules
Then set the selected report in the webpart to the newly created schedule by following: Chart Viewer Web Part
The Query Nintex Reporting action is used to retrieve information from Nintex Reporting for use in Nintex Workflow 2007. This action can be configured to query the data warehouse directly, or retrieve cached report data.
To use the workflow action, drag it from the Actions palette at the left of the page and drop it onto a blue "pearl" on the design canvas. Alternatively, you can right-click a pearl, mouse-over "Insert Action" and select the action you require from the list.
To change the settings used by the action, left click in the action's title bar to activate a drop-down then select "Configure" or double-click the action's icon . For more information on the other options in the drop-down, please refer to the Getting started with the Nintex Workflow designer help page.
Select 'Run now' to perform a new query against the data warehouse or 'pre-run data' to retrieve information from the report result cache. Typically, it is much faster and more efficient to retrieve results from the report result cache.
Select a report to run from the available Nintex Reporting reports in your system.
This option is only available if the Query type is set to 'Run now'. After selecting a report, the parameters available to this report can be configured. You can use the reference inserter to populate report parameters with values from the workflow at run time.
This option is only available if the Query type is set to 'Pre-run data'. After selecting a Pre-run report, the filter option can be used to filter the report results. You can use the reference inserter to populate filter conditions with values from the workflow at run time.
Select a field to order the returned results.
The maximum number of rows of data to be returned from Nintex Reporting.
If ticked, the data returned from Nintex Reporting will be stored as XML into a text variable. Use this option if you wish to perform xml processing on the returned data.
Nintex Workflow does not have a table type workflow variable. Select a single column from the report result to return.
Specify a workflow variable to store the report result. If a single value workflow variable is selected, the value in the 1st row of the selected column will be stored. If a collection variable is specified, each row within the selected column will be stored.
There are two types of filters. Client side Filter and the server side Filter.
You will be able to use the server side Filter in the Web Parts. You can enable the client side Filter by checking the 'Show Client Side Filter' check box.
Client side Filter can only filter the data on the current report page. This filter will only be applicable while visiting the report page. The filter will be removed next time you visit the page.
If a server side filter has already filtered the data, the client side filter can only filter the filtered data by the server side filter.
Once you open the Filter you will be able to add a new filter rule.
Filter dialog will let you choose the parameters for filtering when adding a new filter rule.
You can dynamically add as many rules as you want for filtering.
The Create Report Schedule functionality provides the ability to run a report on a scheduled basis, and results are saved to a
result cache database. This allows a set of report results to be retrieved quickly without having to rerun the query every time.
In addition, they can provide a historical view of data.
To access this functionality, click the "Manage report schedules" link under the "Nintex Reporting" heading in Site Settings.
Next, click on the "Schedule a report to run" link.
Click on the "Select Report" link to open the Report Selector dialog.
Expand the categories and select a report to run.
Clicking OK will then close the Report Selector dialog. The page now displays the parameters applicable for the report selected. Fill in the parameters as required.
Next, fill in the parameters determining when the schedule will start, how often it should repeat execution, and how many results to keep.
Permission to view the report scheduled to run can be restricted to specific SharePoint groups. To restrict access to a specific group, select the "Users within a specific SharePoint group" option
+
Click the "Browse" button. Select the group you wish to restrict access to.
+
This setting can be used to set the status of the report schedule.
+
This setting can be used to enable the workflow process for this schedule.
A Nintex Workflow can be designed for this report schedule. Clicking Create Workflow will save any changes you have made and launch the Nintex Workflow designer. Start data variables corresponding to the columns in the report will be added to the new workflow automatically.
A single workflow can be started every time the report is run, or, a new workflow can be started for each row of the report result. When starting a workflow for each row, specify the maximum number of rows to process and therefore workflows to start.
Nintex Reporting will pass information from the report result to Nintex Workflow via start data variables.
Please note: Create workflow option is only available when editing a report schedule.
+
The Service Management page allows you to configure Nintex Reporting collectors.
This page can be used to configure each service or delete each service's database entry.
You can configure each Collector service after installing. Once you install the Collector Service it will get listed in a table in the main Service Management page. There will be a configuration link in each row of the Collector services list. Click on the configure link of the Collector Service you want to configure.
When you click on the Configure link for a SharePoint Collector you will get a similar configuration dialog as shown below.
You can change the configuration settings of the selected Collector using this dialog.
When you click on the Configure link for a Performance Collector you will get a similar configuration dialog as shown below.
In the Performance Collector configuration dialog you will be able to add performance counters to watch. When you open the Performance Collector Configuration dialog you will be able to see the default performance watch counters added when you first installed the Performance collector.
You can add new counters to watch by selecting a Category, Instance and a Counter. Once you add a counter you will be able to see that in the existing counter list.
You can delete an existing counter by clicking on the delete link following each counter.
Please note: You can only run either the User Profile Collector Service or Active Directory Collector Service in a farm.
When you click on the Configure link for an Active Directory Collector you will get a similar configuration dialog as shown below.
In the Active Directory Collector configuration dialog you will be able to specify database connection strings, indexing frequency, batch size and tracing.
The Run indexing every setting allows you to specify the number of hours between re-crawls of your Active Directory domains. If information is updated infrequently, this should be left at its default of 24 hours.
The Processing batch size settings allows you to specify the number of Active Directory accounts to process at a time. It is recommended that for normal environments, this be left at the default of 200 users.
When you click on the Configure link for User Profile Collector you will get a similar configuration dialog as shown below.
In the User Profile Collector configuration dialog you will be able to specify database connection strings, SSP site url, resting time in minutes, batch size and tracing.
When you click on the Configure link for Workflow Collector you will get a similar configuration dialog as shown below.
In the Workflow Collector configuration dialog you will be able to specify sleep time, network error sleep time, processing batch time and tracing.
When you click on the Configure link for the Data Management Service you will get a similar configuration dialog as shown below.
In the Data Management Service configuration dialog you will be able to specify database connection strings and tracing.
You will be able to delete just the database entry of a service by clicking on the delete link of a corresponding service. This operation is useful when you have an orphan record in the database. Please note that this operation will only remove the database entry and it will not uninstall the service.
The Data Management Service is responsible for running report schedules. More than one Data Management Service can be added.
The "Data Management Service Settings" page will list all instances.
To add a service, click on the "Install a Data Management Service" link - a dialog will be displayed.
On the dialog page, the following information must be provided
Server Name: The machine on which to install the service
User Credentials: You must be an administrator on the selected server
Service Account: The Data Management Service runs as a windows service, and
therefore runs using a service account
Service Port: The port number the data management service will use
Click the "Ok" button to start the installation process
Note if you have installed a Data Management Service instance manually and need to add the instance to the system, check the "Add Existing Service" check box on the top right corner.
The Import page will be displayed. Click "Browse" and locate your new license file.
Once the file is located, click on the "Import" button.
The new license will be displayed.
When you have a Work Group Edition license you will be able to see the Team Site Reporting enabled sites under the 'Enabled Sites' section. You have the ability to deactivate Team Site Reporting from the license page for a corresponding team site by clicking the 'Deactivate' button.
The Database Maintenance page provides the ability to schedule index maintenance on all tables in both the Nintex Reporting System Configuration and Cache Database and the Nintex Reporting Data Warehouse Database.
For Sql Server 2000, the process uses the DBCC REINDEX command for all indexes on all tables.
For Sql Server 2005 and Sql Server 2008, the process uses the ALTER INDEX command for all indexes fragmented by at least 10%, on all tables.
- For indexes which are fragmented by more than 30%: the REBUILD keyword is used.
- For indexes which are fragmented by between 10% and 30%: the REORGANIZE keyword is used.
To access the Database Maintenance page, click on the Database Maintenance link in the Central Administration Nintex Reporting section.
By default, the process is disabled, and must be enabled using this Central Administration page.
The schedule can be set to run each day at the same time by specifying "Daily", or on particular days by specifying "Weekly".
Use the dropdown list of times to specify when the process is to run.
The Manage Active Directory Settings page provides the ability to specify LDAP domain and mapping settings for the
Nintex Reporting Active Directory Collector.
The collector will iterate through all entries and collect information from each domain specified, using the LDAP Path, Netbios Name, Search
Filter and Subtree settings, connecting to each domain using the credentials provided.
To access the Manage Active Directory Settings page, click on the Manage Active Directory Settings link in the Central Administration Nintex Reporting section.
Clicking the link will navigate you to the Manage Active Directory settings page.
Click the Add Domain link to create a new Domain. This navigates you to the Add Domain page.
Enter Domain details. Note the you must specify a valid LDAP Path. The Username and Password specified will be used by the
Nintex Reporting Active Directory Collector to connect to the Domain and collect user details.
Use the radio buttons to select an appropriate search filter, or specify your own by ticking the Custom search filter option.
Tick the checkbox next to Search AD Subtree to ensure the Nintex Reporting Active Directory Collector traverses
the entire tree below your specified LDAP Path. Leaving this unchecked ensures the collector only searches the immediate child
objects in the specified LDAP Path.
After clicking OK, you are returned to Manage Active Directory settings page.
Click the link in the Netbios Name column to edit a Domain. This takes you to the Edit Domain page.
Clicking the Domain Mappings link at the bottom of the Edit Domain page allows you to specify column mappings.
Source Column refers to an attribute name in Active Directory. Destination Column refers to an entity in the Nintex Reporting
database. You can remap a Nintex Reporting entity to get its data from any Active Directory attribute.
Note that only single-value attributes are valid. For example, mapping a multi-value attribute such as memberOf is not supported.
Note also that you cannot remap the LoginName or Manager Destination Column entries. These are required by the collector.
It is recommended that you only map Active Directory attributes which are common amongst a large number of Active Directory users. The aim
of the Nintex Reporting Active Directory Collector is to allow you to group users within a report based on a common value, such as Department,
Location or Manager.
To delete a domain entry, navigate to the Manage Active Directory settings page, and click the cross in the Remove column
SharePoint Auditing can be configured for the entire web application or on each Site Collection individually.
Click on the tree node to configure.
Check the items you wish to audit. Checking all audit options is recommended.
Click "OK" to save all changes made to the audit settings when finished.
In order for some reports to display correctly, Nintex Reporting keeps a mapping of all the known file types. Files types can be mapped as system and image files.
The "Manage File Types" page will display the current file type mappings.
To modify the settings, check / uncheck the "Image" or "System File" column, click "OK" when finished.
The subscription message template is the email message sent to all report subscribers with the attached report.
The email message consists of a header, body, and footer.
The Insert Reference button can be used to insert report specific information in the email message such as a link to the actual report page, the report page title, and links to manage subscriptions.
System account activities can be excluded from report results. The Manage System Accounts page can be used to nominate system accounts.
To remove a system account, click on the "x" image beside the account under the "Remove" column. To add an account, click on the "Add Account" link and the "Add System Account" page will show.
Select the account on this page and click the "OK" button
The Manage User Filters page allows you to create grouping rules based on user attributes collected by either the Nintex Reporting
Active Directory Collector, or the Nintex Reporting SharePoint User Profile Collector.
User Filters encapsulates complex rules such as Company=acme and Department=SALES and (Country=USA or Country=Germany) into
a single named filter like USA and Germany Sales Groups.
The named filter can then be used when running reports to return results only for user who fit the rules specified in the filter.
To access the Manage Active Directory Settings page, click on the Manage User Filters link in the Central Administration Nintex Reporting section.
Clicking on the link will take you to the Manage User Filters page.
Click the Add Filter link to create a new User Filter.
The field dropdown list shows all the available filter columns. Note that you can use the Manage Active Directory Settings page to specify which Active Directory or SharePoint User Profile Database field is related to each filter column.
Enter the filter name, and specify a condition, for example Country=UNITED STATES.
Note that the available values for each column are taken from either Active Directory (populated by the Nintex Reporting Active Directory
Collector) or the SharePoint User Profile Database (populated by the Nintex Reporting SharePoint User Profile Collector).
You can add multiple conditions using And and Or logical operators.
After clicking OK, you are returned to Manage User Filters page. Click on the name to edit a User Filter.
Applicable reports include a User Filter parameter. By default, this will include the item All.
Once User Filters are created, they will appear in the User Filter parameter dropdown list.
After the report is run, the selected User Filter is displayed in the Report Parameters box.
The Create Nintex Report Center page allows you to provision the Nintex Reports.
You can change the current web application by using the web application picker. In the Site URL text box you can either type the site URL or select a site from the site picker by clicking on the All Site Collection link. Once you click on this link, the site picker dialog will appear as shown in the figure below.
You can specify a document library name and create the Nintex Report Center. This might take several minutes to create the Nintex Report Center. Once the operation is completed you will see a link to the created Nintex Report Center.
You can navigate to Nintex Report Center by clicking on the document library URL. You can delete Nintex Report Center by clicking on the delete button.
This feature is not available for workgroup license edition
This page can be used to enable or disable Silverlight Compression option. Enabling this option will increase the performance of your pages.
Please note: Make sure you uncheck this option If the Compression setting in IIS (Internet Information Services) for your website is enabled.
This setting is automatically configured by Nintex Reporting Configuration Wizard.
This setting can be used to activate Team Site Reporting on a particular web application or all content web applications.
Use this setting to enable or disable Nintex Workflow components for Nintex Reporting. You can choose either a particular web application or all content web applications.
Use this setting to provision Nintex Workflow Reports. Once the workflow reports are successfully created you will be able to see Workflow Manager in Nintex Reporting dashboard. Under Workflow Manager you will be able to see all the workflow related reports.
The System Status page provides a high level overview of the different components of Nintex Reporting.
This page provides a summary of the Reporting Schedule processing. Total Time column displays the time taken for each report schedule to run.
Use this page to edit the User Profile Mapping
Source Column refers to an attribute name in the User Profile. Destination Column refers to an entity in the Nintex Reporting database. You can remap a Nintex Reporting entity to get its data from any User Profile attribute. Note that only single-value attributes are valid. For example, mapping a multi-value attribute such as memberOf is not supported. Note also that you cannot remap the LoginName or Manager Destination Column entries. These are required by the collector.
This page provides information about the Report Processing
This is a more detailed view of a selected report from the schedules page. If TSR is activated for the selection, you will be able to navigate to that site by clicking on the link in TSR Site column.